Fleet management · included
Mount it on the forklift. For a limited time, get telematics for free.
Productivity, utilization, kWh per truck — all from the device the credits already pay for. The data stream is included with the REM.
What you see
The same device that earns your clean-fuel credits runs the fleet.
Every kWh that flows through a REM is tagged to a vehicle and a session. The data that proves your credits is the same data that runs your operation.
Utilization by vehicle
Hours under load, idle hours, charging hours — per truck, per shift, per depot. Surface the underused forklift and the overworked one in the same view.
kWh per truck
Energy use, normalized by hour and by shift. Catch drift early. Confirm that a new battery is performing the way the spec said it would.
Charger occupancy
Which chargers are stacked. Which are dead. When the depot peaks. Right-size your charging footprint without guessing.
Shift comparisons
Compare crews, sites, and equipment classes side by side. Spot the patterns spreadsheets miss.
Alerts that mean something
A charger that's been dark for 48 hours. A truck pulling double the kWh of its peers. We tell you. Once.
Exports your team will use
CSV, API, scheduled emails to the operations lead. No proprietary export format. No hostage data.
Two install options. One platform.
Mount on the charger. Mount on the vehicle. Either way, the data flows.
Anvil REMs install on the DC side of your charger or directly on the vehicle. Both options satisfy LCFS requirements. The right choice depends on what you want to track.
Charger install
Per-charger visibility. Simplest deployment.
One REM per charger. Tracks every kWh that flows through that station regardless of which truck plugs in. Ideal for depots that want to maximize charger utilization data without tracking individual vehicles.
- Stays with the infrastructure. No tracking across vehicle rotations.
- Fastest install. One tech visit covers the entire charger bank.
- Full LCFS compliance — CARB accepts charger-side metering.
Vehicle install
Per-truck data. Built-in telematics.
One REM per vehicle. Every kWh is tagged to a truck, a shift, and a session — no matter which charger it used. The same device that earns your credits also runs your fleet analytics.
- Follows the asset. Survives battery swaps and depot rotations.
- Productivity, utilization, kWh per truck — no extra subscription.
- One REM per truck. Tagged, auditable data from day one.
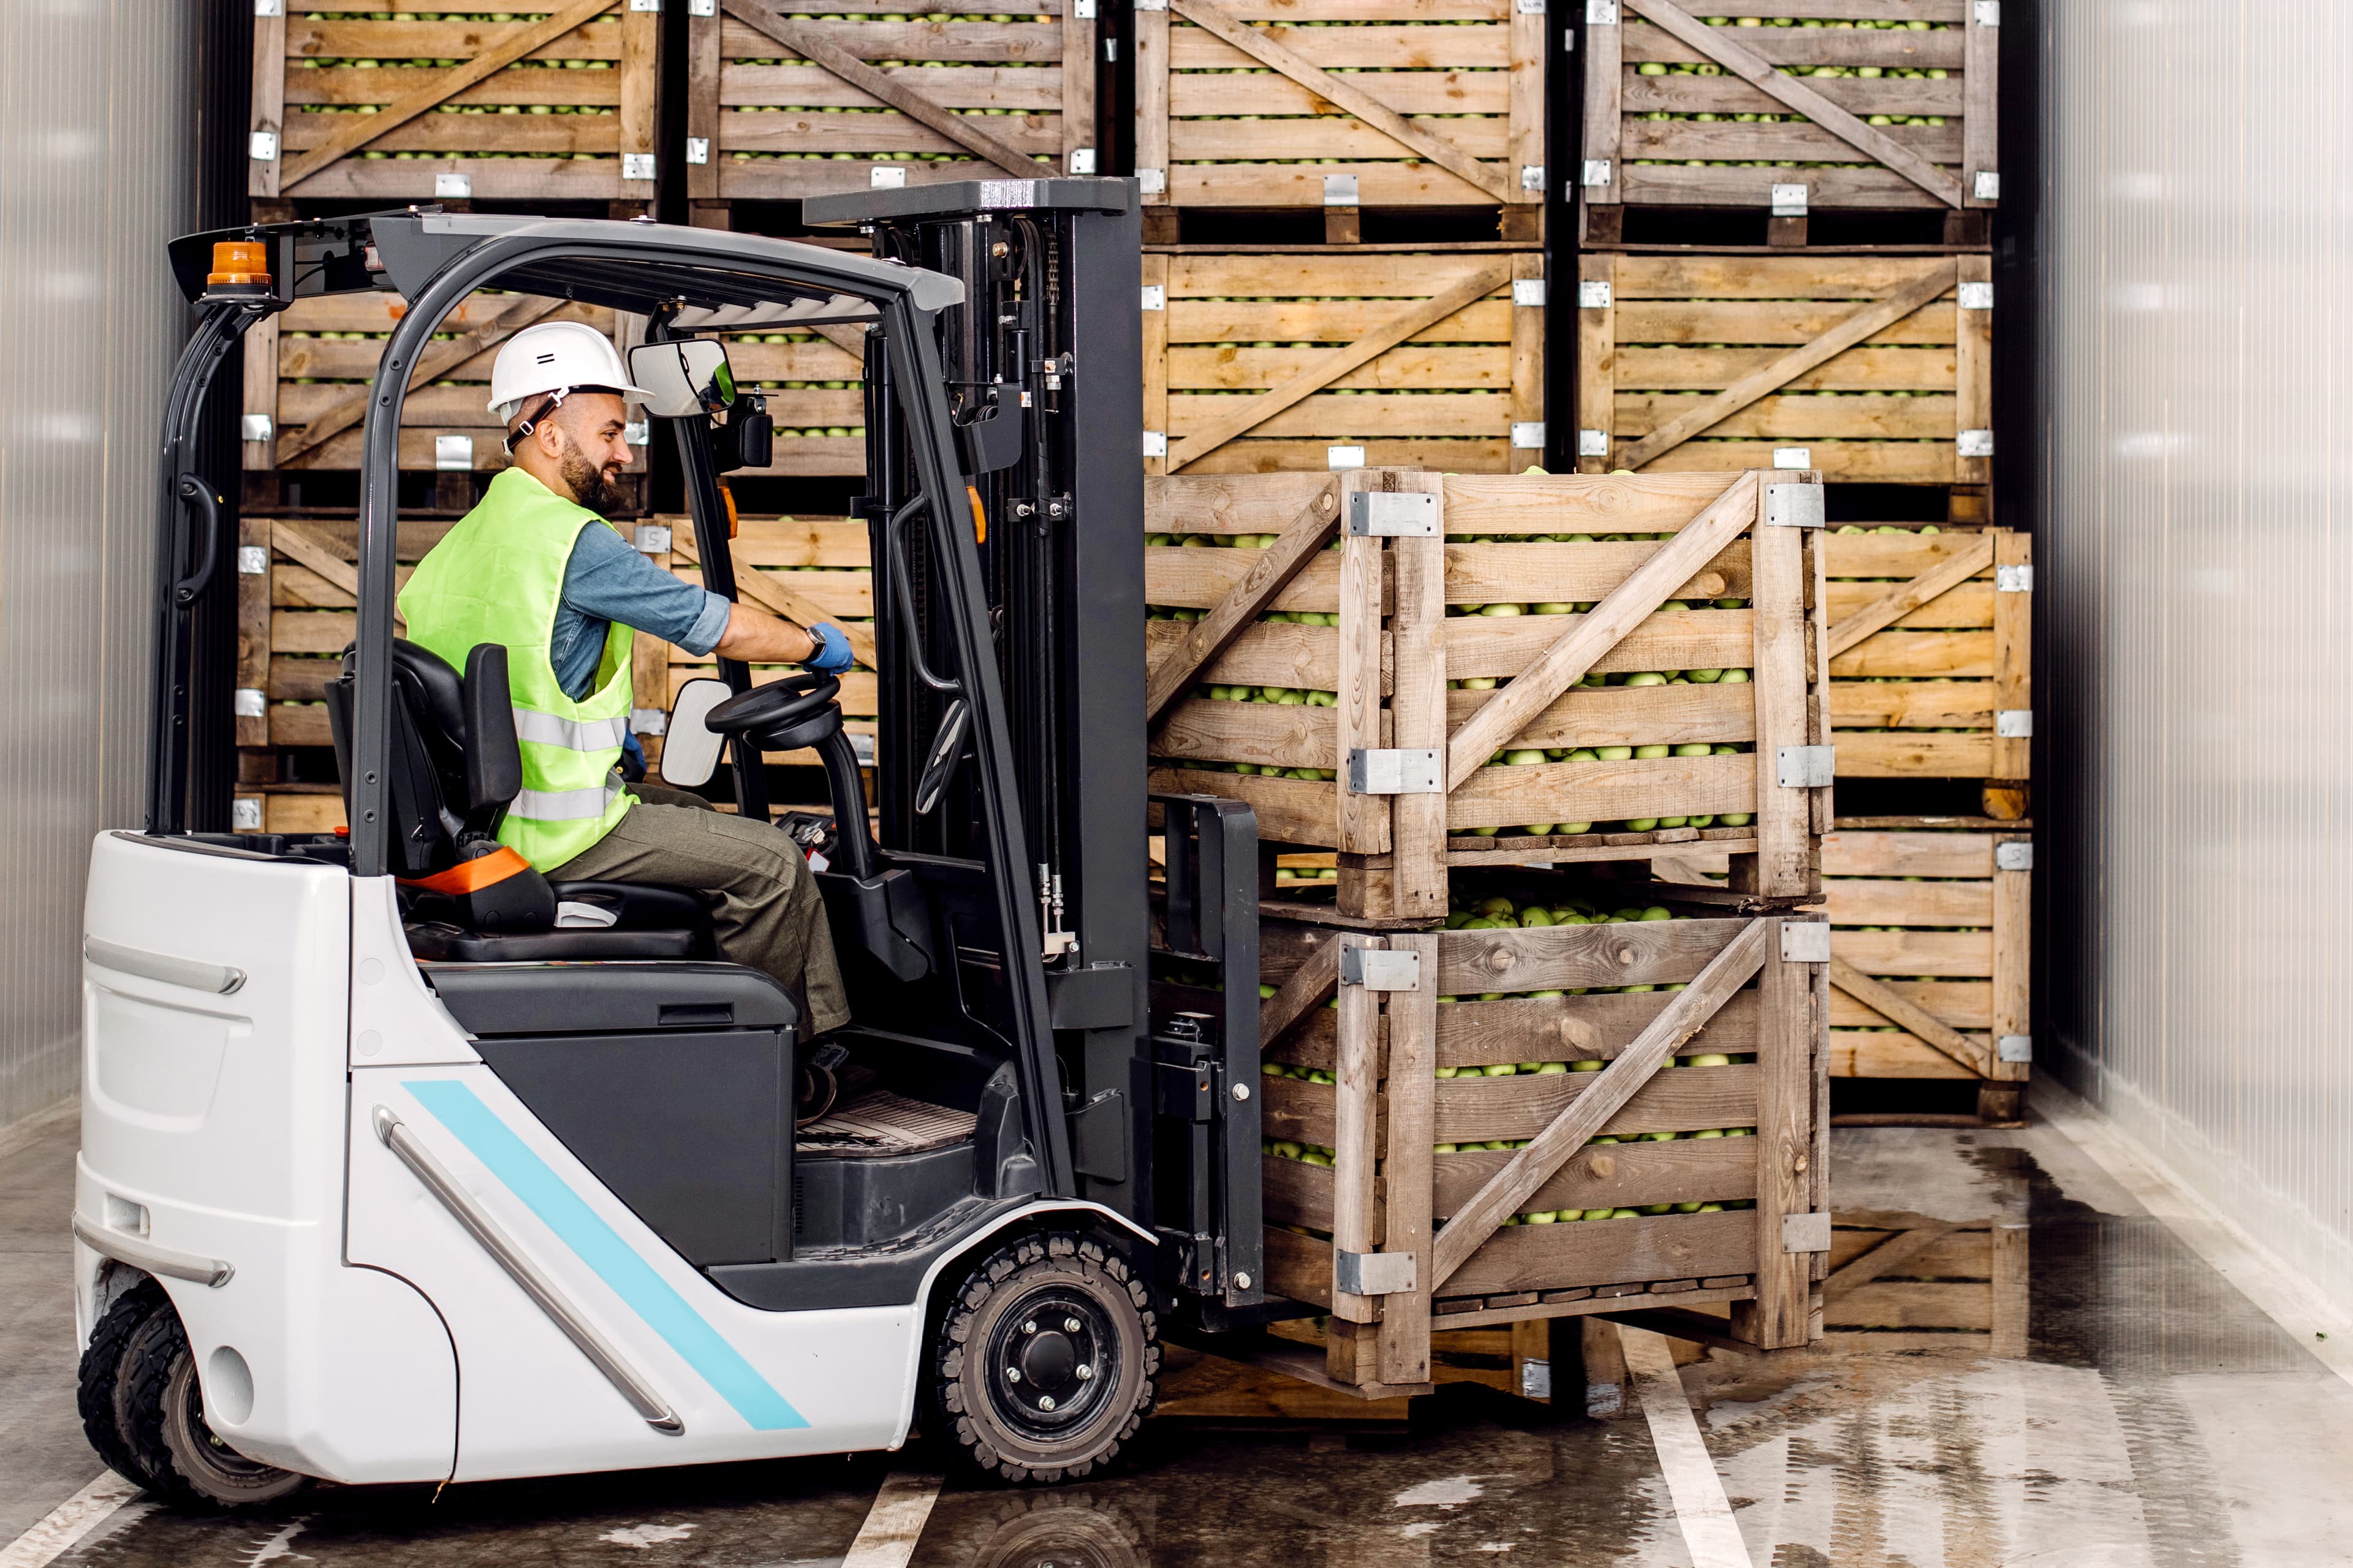
Fleet management · vehicle install
Per-vehicle data unlocks the full telematics picture.
A charger-side install tells you how much energy left the wall. A vehicle-side install tells you which truck used it, on which shift, doing which work — and gives you the fleet layer on top.
Both options report to your clean-fuel credit program. Only one of them also tells you why your warehouse manager keeps asking for a sixth forklift she doesn't need.
- One REM per truck. Tagged data from day one.
- Survives battery swaps and depot rotations. Follows the asset.
- No additional telematics subscription. No extra hardware bill.
A sample row · the way the platform shows it
Numbers, bare. Units, explicit.
A single row in the dashboard tells you which REM, how much energy it's logged, and what that energy is worth. Tagged by vehicle. Auditable. Yours to export.
Ready to see your fleet in numbers?
Send us a charger count and a depot list. We'll show you what the data looks like.